
Kubecost 2.0 安裝 with Helm 小記
OS: openSUSE Leap 15.5
Kubernetes: 1.28.3 in Azure AKS
Helm: 3.13.2
上次實驗 kubecost 是 2022 年了, 可以參考上一篇筆記
這篇有說明如何安裝 Helm
參考官方安裝文件
Helm client 3.1 以上
有安裝 kubectl
符合支援的 Kubernetes - https://docs.kubecost.com/install-and-configure/install/environment
開始之前先觀察資訊
> helm version
version.BuildInfo{Version:"v3.13.2", GitCommit:"2a2fb3b98829f1e0be6fb18af2f6599e0f4e8243", GitTreeState:"clean", GoVersion:"go1.20.10"}
> helm list
NAME NAMESPACE REVISION UPDATED STATUS CHART APP VERSION
> helm repo list
NAME URL
kubecost https://kubecost.github.io/cost-analyzer/
grafana https://grafana.github.io/helm-charts
gitlab https://charts.gitlab.io/
因為目前用的 Kubernetes Server 為 1.28.3, 原來的 kubectl 版本為 1.26
建議是不要差異超過 1 個版本以上, 所以 1.28 的 server, client 至少就要 1.27
我使用 > gcloud components update kubectl 升級我的 kubectl
> kubectl version
Client Version: v1.28.5
Kustomize Version: v5.0.4-0.20230601165947-6ce0bf390ce3
Server Version: v1.28.3
Kubecost 這次安裝把上次的 3 個步驟整合在一個指令中
> helm install kubecost cost-analyzer \
--repo https://kubecost.github.io/cost-analyzer/ \
--namespace kubecost --create-namespace \
--set kubecostToken="c2FrYW5hQGN5Y3Uub3JnLnR3xm343yadf98"
NAME: kubecost
LAST DEPLOYED: Tue Feb 13 15:50:12 2024
NAMESPACE: kubecost
STATUS: deployed
REVISION: 1
NOTES:
--------------------------------------------------
Kubecost 2.0.2 has been successfully installed.
Welcome to Kubecost 2.0!
Kubecost 2.0 is a major upgrade from previous versions and includes major new features including a brand new API Backend. Please review the following documentation to ensure a smooth transition: https://docs.kubecost.com/install-and-configure/install/kubecostv2
For the full list of enhancements, please see our release notes: https://github.com/kubecost/cost-analyzer-helm-chart/releases/tag/v2.0.0
When pods are Ready, you can enable port-forwarding with the following command:
kubectl port-forward --namespace kubecost deployment/kubecost-cost-analyzer 9090
Then, navigate to http://localhost:9090 in a web browser.
Please allow 25 minutes for Kubecost to gather metrics. A progress indicator will appear at the top of the UI.
Having installation issues? View our Troubleshooting Guide at http://docs.kubecost.com/troubleshoot-install
這邊如果本來沒有 kubecost 的 namespace, 會一併建立
安裝名稱為 kubecost
再次觀察資訊
> helm list -A
NAME NAMESPACE REVISION UPDATED STATUS CHART APP VERSION
kubecost kubecost 1 2024-02-13 15:50:12.958799828 +0800 CST deployed cost-analyzer-2.0.2 2.0.2
my-release default 1 2023-06-30 14:18:02.033192523 +0800 CST deployed grafana-6.57.4 9.5.5
這邊記得用 -A 來列出所有的 namespace 的 helm 安裝, 因為有很多套件都會有獨立的 namespace, 如果沒有切換過去, 或是使用 -A 不會顯示
> kubectl get deployments
NAME READY UP-TO-DATE AVAILABLE AGE
kubecost-cost-analyzer 1/1 1 1 14m
kubecost-forecasting 1/1 1 1 14m
kubecost-grafana 1/1 1 1 14m
kubecost-prometheus-server 1/1 1 1 14m
這樣 kubecost 就安裝完成了, 只要 3 步驟
如同提示那樣, 透過 kubectl port-forward 來觀察 kubecost
> kubectl port-forward --namespace kubecost deployment/kubecost-cost-analyzer 9090
打開瀏覽器的 http://localhost:9090
點選要觀察的 Cluster
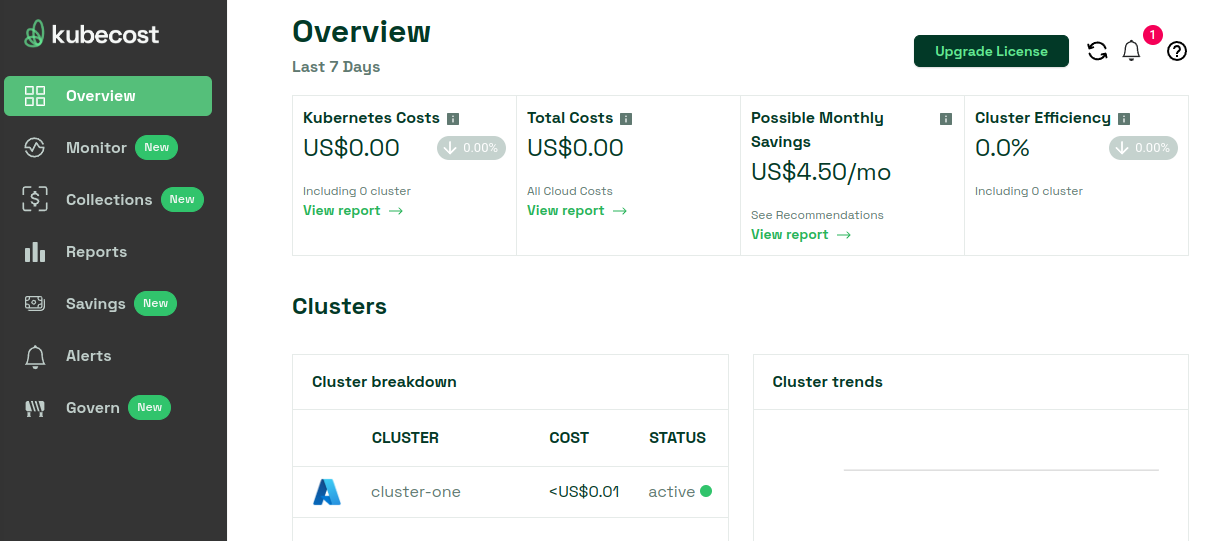
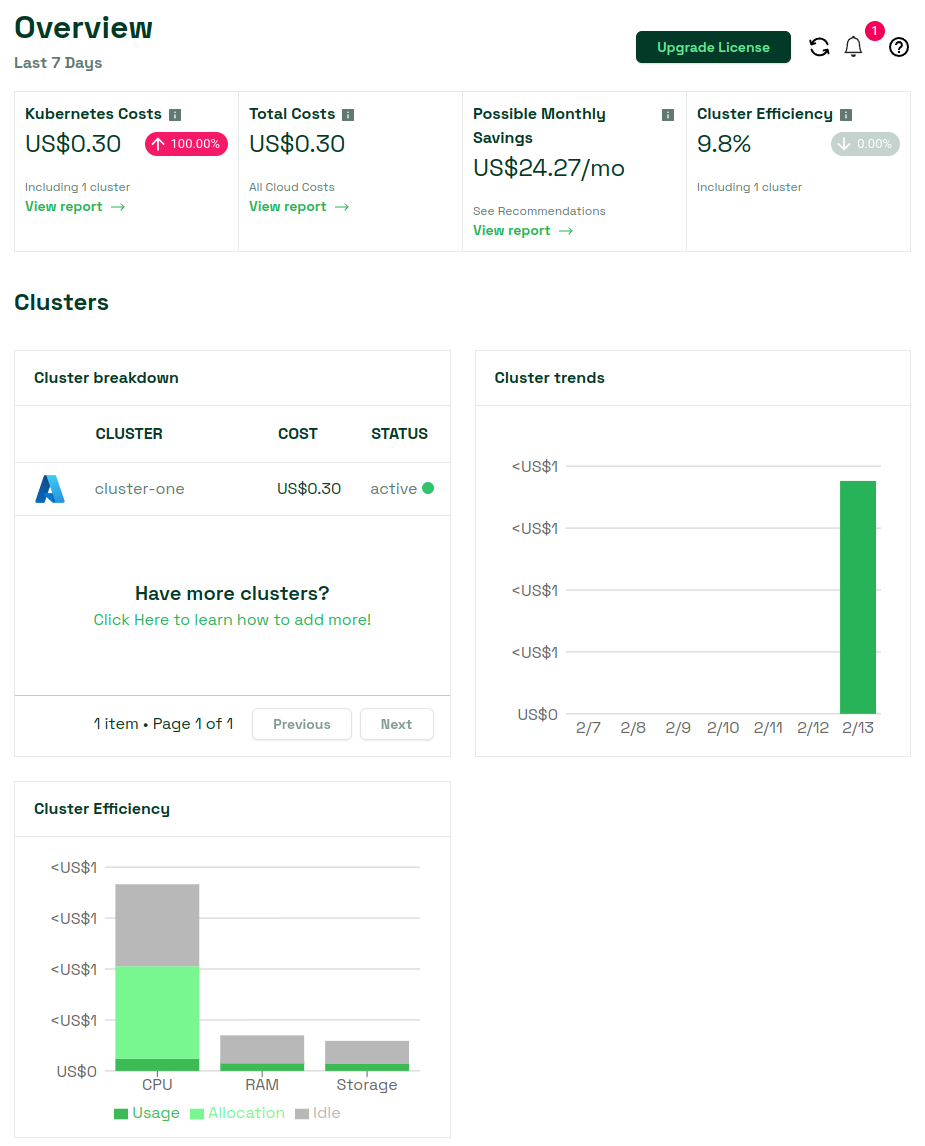
首先會出現 Overview 的介面, 但是一開始不會馬上出現資料, 他需要一段時間
放一段時間畫面大概如下
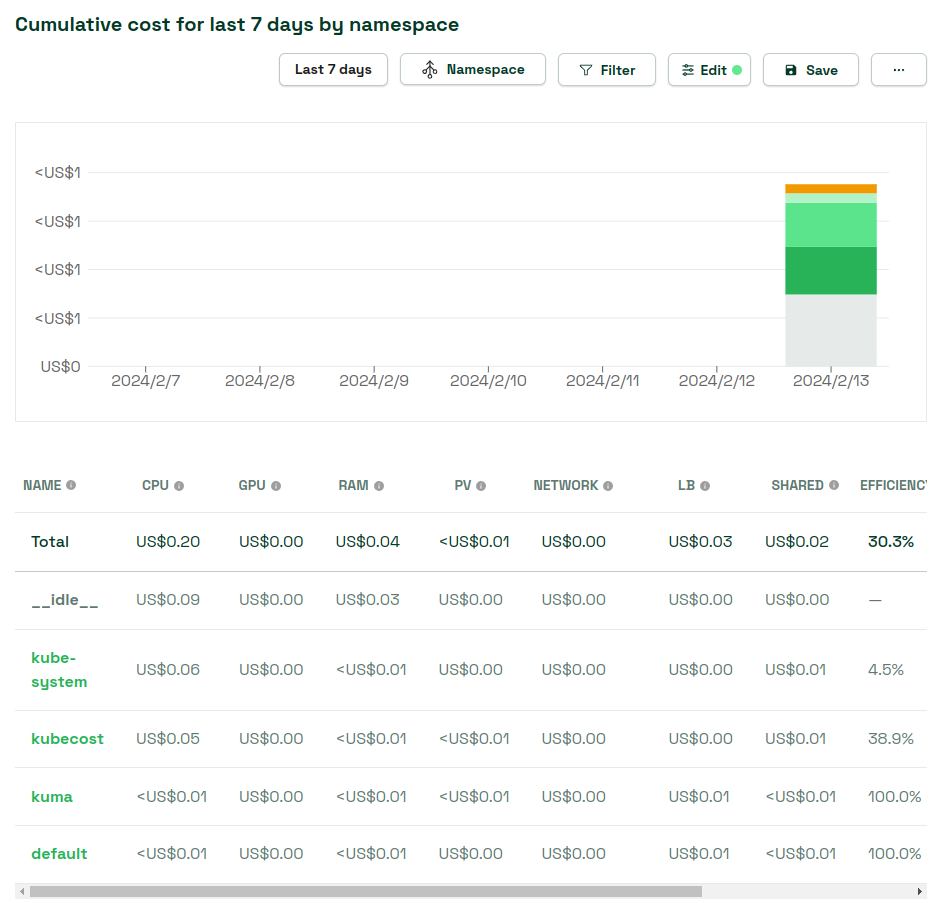
Monitor 的 Allocation 的部份可以依照你指定的分類來觀察費用
例如 7 天內按照 Namespace 來觀察
或是按照 Pod 來觀察
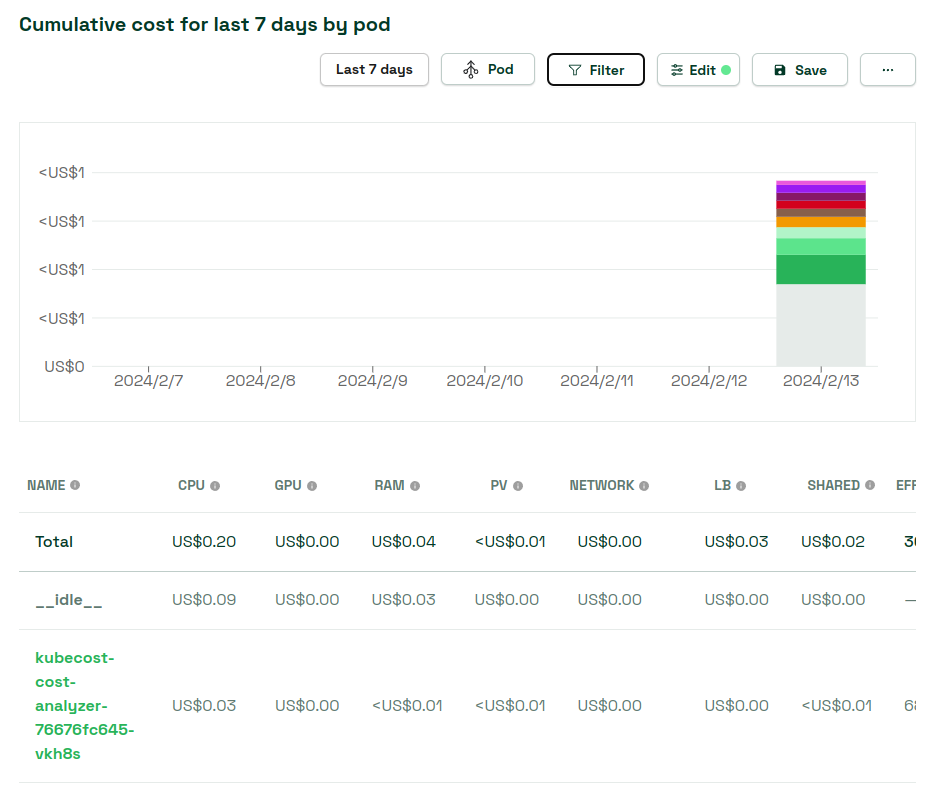
有不同的分類方式
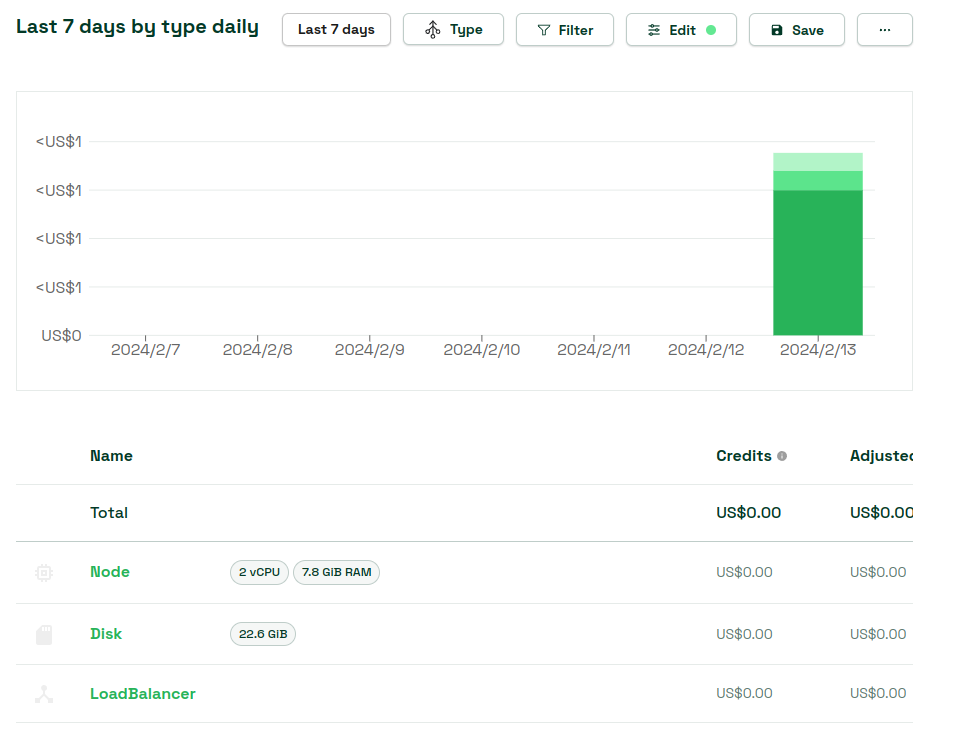
Assets 則可以用不同的角度來看花費
Savings 則是最有趣也是最重要的區塊
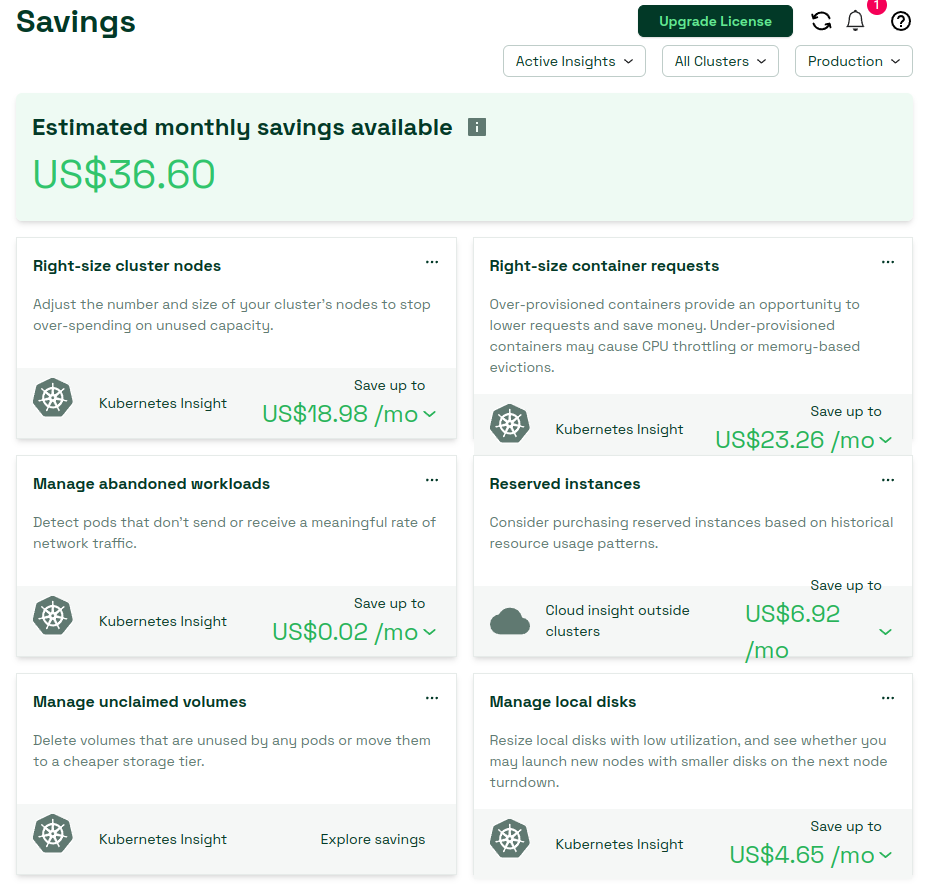
會根據你的使用量, 提出建議, 例如可以調整 Cluster nodes 的大小來進行節費
相關資訊也可以參考官方文件
又向 Kubernetes 前進一步
~ enjoy it
Reference
沒有留言:
張貼留言