AWS S3 與 GCP GCS 快速查看用量小記
在工作實務上, 有時因為成本估算或是專案狀況報告的關係要快速知道目前 Storage 的使用量
所以就把如何快速查看 AWS S3 或是 GCP GCS 的用量方式紀錄一下, 以免之後臨時要觀察忘記方式 :)
==== AWS ====
Console 方式
登入到 AWS Console 介面
進入到要觀察的 S3 Bucket
點選 Management -- > 點選 Metrics -- > 點選 Storage
觀察 BucketSizeBytes 可以知道該 Bucket 的用量

這個指標實際上自己的觀察大概要 1.5 天之後才會顯示出來
另外一種觀察方式是到 CloudWatch
選取 S3 bucket 所在的 Region
點選 Metrics -- > 點選 S3 -- > 點選 Storage Metrics
勾選 BucketSizeBytes
就會出現相關資訊

指令方式
透過指令找出 StorageType 與 BucketName
# aws cloudwatch list-metrics --metric-name BucketSizeBytes --region us-east-2 --profile default
{
"Metrics": [
{
"Namespace": "AWS/S3",
"MetricName": "BucketSizeBytes",
"Dimensions": [
{
"Name": "StorageType",
"Value": "StandardStorage"
},
{
"Name": "BucketName",
"Value": "test2020071420"
}
]
}
]
}
透過取得的資訊來取得大小
# aws cloudwatch get-metric-statistics --namespace AWS/S3 --dimensions Name=BucketName,Value=test2020071420 Name=StorageType,Value=StandardStorage --metric-name BucketSizeBytes --start-time 2020-07-01 --end-time 2020-07-30 --period 86400 --statistics Average --unit Bytes --region us-east-2 --profile default
{
"Label": "BucketSizeBytes",
"Datapoints": [
{
"Timestamp": "2020-07-17T00:00:00+00:00",
"Average": 31457325.0,
"Unit": "Bytes"
},
{
"Timestamp": "2020-07-15T00:00:00+00:00",
"Average": 10485782.0,
"Unit": "Bytes"
},
{
"Timestamp": "2020-07-16T00:00:00+00:00",
"Average": 31457325.0,
"Unit": "Bytes"
}
]
}
--period 是要取樣的區間, 86400 是一天, 取樣的方式是 Average
預設的單位是 Bytes, 嘗試過 Megabytes, 但是沒有成功
所以輸出就會根據區間來顯示結果
==== GCP ====
Console方式
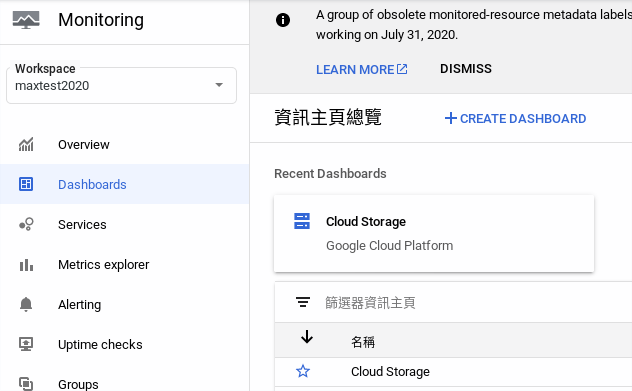
登入 GCP Console
點選 Monitoring -- > Dashboards
點選 Cloud Storage
點選 Object Size 的選項 (...) -- > 點選 Open in Metrics Explorer

這樣的好處是會自動在 Metrics explorer 內帶入 Resource type, Metric 以及 Group By

如果把 Group By 拿掉就可以觀察整個專案的用量
指令方式
可以使用 Cloud-Shell
$ gsutil -o GSUtil:default_project_id=YOUR_PROJECT_ID du -shc
30 MiB gs://test2020071402
30 MiB total
請換成自己的 project id
這樣就算是紀錄如何快速查詢的方式了
不管 AWS 或是 GCP, 相關的 Metric 都不會馬上出現, 所以如果沒有現有的資料, 最好等一段時間, 實務上觀察大概 1.5 天左右
那就先這樣了
~ enjoy it
Reference
沒有留言:
張貼留言