星期日, 2月 25, 2018

tmate with openSUSE Leap 42.3

tmate with openSUSE Leap 42.3
使用 tmate 即時分享終端機

OS:  openSUSE Leap 42.3 in Azure

之前在社群舉辦活動的時候, 使用 OBS Studio ( https://obsproject.com/  ) 來進行活動直播
那個時候就有思考, 如何即時分享講者的終端機操作

那個時候找到 tmate 這個軟體
  • 官方網站 https://tmate.io/
  • 可以即時以 SSH 或是 Web 方式分享終端機
  • 可以指定 Read-only 方式連線 SSH 或是 Web終端機

首先搜尋套件 tmate

# zypper  search   tmate
Loading repository data...
Reading installed packages...

S | Name  | Summary                  | Type   
--+-------+--------------------------+--------
 | tmate | Instant terminal sharing | package

安裝 tmate 套件

# zypper  install  tmate
Loading repository data...
Reading installed packages...
Resolving package dependencies...

The following 3 NEW packages are going to be installed:
 libmsgpackc2 libssh4 tmate

3 new packages to install.
Overall download size: 412.6 KiB. Already cached: 0 B. After the operation, additional 1.0 MiB will be used.
Continue? [y/n/...? shows all options] (y): y

因為 tmate 是透過 ssh 跟官網那邊進行連線, 所以要先建立 SSH 金鑰
先觀察目錄

# ls -a  ~
.  ..  .bash_history  .gnupg  bin

用 ssh-keygen 指令建立 SSH 金鑰
預設放在家目錄 ~/.ssh 目錄內 , 這邊是以 DSA 為例

# ssh-keygen  -t  dsa
Generating public/private dsa key pair.
Enter file in which to save the key (/root/.ssh/id_dsa):
Created directory '/root/.ssh'.
Enter passphrase (empty for no passphrase):
Enter same passphrase again:
Your identification has been saved in /root/.ssh/id_dsa.
Your public key has been saved in /root/.ssh/id_dsa.pub.
The key fingerprint is:
SHA256:exF8nA9WJ+arFCxZitM73rlJhv8zSLwozlFrFQyAnZ8 root@test01
The key's randomart image is:
+---[DSA 1024]----+
|       o.o. . + .|
|      . o+ O = o |
|        o.B.@ .  |
|         .E* = . |
|        S =.o o  |
|         + Ooo   |
|        o *o*o   |
|       ..+.+ooo  |
|       .o.  +..o |
+----[SHA256]-----+


再次觀察目錄

# ls  -a  ~/.ssh
.  ..  id_dsa  id_dsa.pub


執行 tmate 指令啟動 tmate
# tmate

這個時候其實可以觀察 /tmp 目錄
底下應該有 tmate相關目錄

# ls   /tmp/
.ICE-unix  .Test-unix  .X11-unix  .XIM-unix  .font-unix  tmate-0

如果有在執行tmate的時候, 該目錄底下會有 socket 檔案
# ls -l   /tmp/tmate-0/
total 0
srwxrwx--- 1 root root 0 Feb 25 07:37 bm33KG

使用 tmate  show-messates 顯示連線相關資訊

# tmate  show-messages
Sun Feb 25 06:40:13 2018 [tmate] Connecting to ssh.tmate.io...
Sun Feb 25 06:40:13 2018 [tmate] Note: clear your terminal before sharing readonly access
Sun Feb 25 06:40:13 2018 [tmate] web session read only: https://tmate.io/t/ro-x0iPdPMpfkFxXa8UPQmLUnPEH
Sun Feb 25 06:40:13 2018 [tmate] ssh session read only: ssh ro-x0iPdPMpfkFxXa8UPQmLUnPEH@ny2.tmate.io
Sun Feb 25 06:40:13 2018 [tmate] web session: https://tmate.io/t/H7FQW5vPlqKEVnCUMXKnSd2QS
Sun Feb 25 06:40:13 2018 [tmate] ssh session: ssh H7FQW5vPlqKEVnCUMXKnSd2QS@ny2.tmate.io

分享之前記得清畫面 :p

這邊會看到有分 web session read only, web session還有 ssh session read only 以及 ssh session.

差異只在是否可以操作指令

Web session 部份只要在瀏覽器開啟連結就好
例如


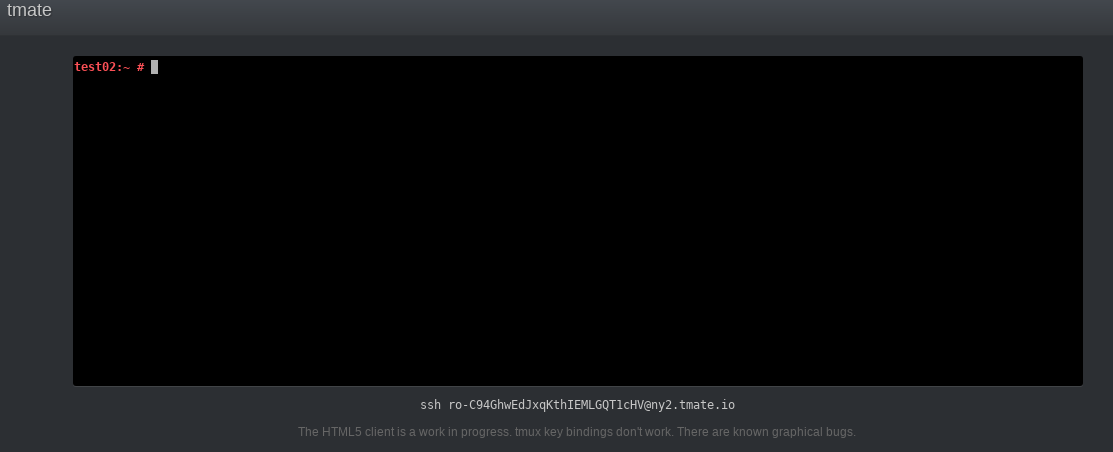
SSH Session 部份也是在終端機按照連結連線即可

先記下來

~ enjoy it


Reference:


星期六, 2月 24, 2018

Acct with openSUSE Leap 42.3

Acct with openSUSE Leap 42.3

OS: openSUSE Leap 42.3 in Azure

之前看到的文章, How to Monitor User Activity with psacct or acct Tools
今天找機會來實作一下

先搜尋相關套件
在 openSUSE 這邊是 acct 套件

# zypper  search   acct
Loading repository data...
Reading installed packages...

S | Name                     | Summary                                                | Type      
--+--------------------------+--------------------------------------------------------+-----------
 | acct                     | User-Specific Process Accounting                       | package   

安裝 acct 套件

# zypper  install  acct
Loading repository data...
Reading installed packages...
Resolving package dependencies...

The following NEW package is going to be installed:
 acct

1 new package to install.
Overall download size: 65.7 KiB. Already cached: 0 B. After the operation, additional 161.1 KiB will be used.
Continue? [y/n/...? shows all options] (y): Y

確認服務狀態

# systemctl   status  acct.service
● acct.service - Process accounting
  Loaded: loaded (/usr/lib/systemd/system/acct.service; disabled; vendor preset: disabled)
  Active: inactive (dead)
    Docs: man:accton(8)

啟動 acct 服務

# systemctl  start  acct.service

再次觀察服務

# systemctl   status   acct.service
● acct.service - Process accounting
  Loaded: loaded (/usr/lib/systemd/system/acct.service; disabled; vendor preset: disabled)
  Active: active (exited) since Sat 2018-02-24 11:29:28 UTC; 3s ago
    Docs: man:accton(8)
 Process: 21556 ExecStart=/usr/sbin/accton /var/log/account/pacct (code=exited, status=0/SUCCESS)
 Process: 21552 ExecStartPre=/usr/bin/chmod 600 /var/log/account/pacct (code=exited, status=0/SUCCESS)
Main PID: 21556 (code=exited, status=0/SUCCESS)

設定開機啟動

# systemctl  enable  acct.service
Created symlink from /etc/systemd/system/multi-user.target.wants/acct.service to /usr/lib/systemd/system/acct.service.

確認相關設定

# systemctl  is-enabled  acct.service
enabled

參考網路上找到的 ac 指令 man page

# ac  --help
               Usage: ac [-dhpVy] [-f <file>] [people] ...
               [--daily-totals] [--individual-totals] [--file <file>]
               [--complain] [--reboots] [--supplants] [--timewarps] [--print-year]
               [--compatibility] [--print-zeros] [--debug] [--tw-leniency <value>]
               [--tw-suspicious <value>] [--version] [--help]

The system's default login accounting file is /var/log/wtmp

ac 是使用 /var/log/wtmp 來進行相關資訊報告
  • ac prints out a report of connect time (in hours) based on the logins/logouts in the current wtmp file. A total is also printed out.

wtmp 檔案如果用 vim 或是 cat 方式, 是人類看不懂的, 在網路上面搜尋之後, 是使用 last 指令來觀察

# last  -f   /var/log/wtmp
sakana   pts/0        110.50.148.40    Sat Feb 24 12:13   still logged in   
sakana   pts/0        110.50.148.40    Sat Feb 24 11:18 - 11:33  (00:15)    
reboot   system boot  4.4.104-39-defau Sat Feb 24 08:48 - 12:23  (03:34)  

接下來試試看 ac 指令

# ac
total        0.47

這個時候出現 0.47 ( 單位是上面的 in hours, 也就是 0.47 小時 )

以每日為單位的方式來統計
# ac   -d
Today total        0.50

以人為單位來統計

# ac   -p
sakana                               0.54
ines                                 0.00
total        0.54

指定某個使用者來統計

# ac  -p   sakana
sakana                               0.56
total        0.56

接下來測試 sa 指令

網路上找的 man page

# sa  --help

               Usage: sa [ options ] [ file ]
               
               options: [-abcdfiljkmnprstuDKP] [-v <num>] [--version] [--help]
               [--other-acct-file <name>] [--other-usracct-file <name>]
               [--print-seconds] [--dont-read-summary-files] [--debug]
                [--separate-times] [--other-savacct-file <name>] [--percentages]
                [--print-ratio] [--print-users] [--merge] [--user-summary] [--group-summary]
               [--list-all-names] [--not-interactive] [--threshold <num>]
                [--sort-ksec] [--sort-tio] [--sort-sys-user-div-calls] [--sort-avio]
                [--sort-cpu-avmem] [--sort-num-calls] [--sort-real-time] [--ahz hz]
      [--show-paging] [--show-paging-avg]

The system's default process accounting files are:

 raw process accounting data: /var/log/account/pacct
     summary by command name: /var/log/account/savacct
         summary by username: /var/log/account/usracct

這個指令比較有感覺的是 -m 選項
  • -m, --user-summary
    • Print the number of processes and number of CPU minutes on a per-user basis.

# sa  -m
                                    2542     707.54re       0.06cp         0avio      3570k
root                                 2411     544.83re       0.06cp         0avio      3412k
sakana                                 44      61.46re       0.00cp         0avio      4106k
sshd                                   43       2.17re       0.00cp         0avio     11906k
ines                                   43       0.00re       0.00cp         0avio      3388k
postfix                                 1      99.07re       0.00cp         0avio      9006k

還有 -c 選項, 使用百分比方式來顯示, 比較好即時判斷哪些指令使用較多的 cpu time
  • -c, --percentages
    • Print percentages of total time for the command's user, system, and real time values.

# sa  -c
   3055  100.00%     757.85re  100.00%       0.10cp  100.00%         0avio      3604k
   2170   71.03%       0.40re    0.05%       0.04cp   44.02%         0avio      3234k   iptables
     38    1.24%       0.26re    0.03%       0.02cp   18.02%         0avio      4176k   find
      8    0.26%      15.40re    2.03%       0.01cp    8.15%         0avio      9132k   systemd
      5    0.16%       2.16re    0.29%       0.01cp    6.24%         0avio      5964k   man

先說一下 sa 指令對自己的感覺
  • 可以使用 sa -m 來找出登入使用者真的有在操作指令的人
    • 同樣是登入系統, 使用 ac  -p 時間會累積統計, 但是如果這個使用者只是登入系統, 但是沒有操作指令, 他在  sa  -m 上面的 real time 會是 0.00  re
    • 換言之, 如果  sa  -m  發現 有某個使用 real time 一直上升,  可以判斷持續在執行某些動作
  • sa  -c 來找出耗費 cpu time 比較多的指令

最後來測試 lastcomm 指令

網路上找的 man page

# lastcomm  --help
Usage: lastcomm [-hpV] [-f file] [command] ... [user] ... [terminal] ...
      [--forwards] [--file <file>] [--strict-match] [--print-controls]
      [--user <name>] [--tty <name>] [--command <name>] [--debug]
      [--show-paging] [--version] [--help]

The system's default process accounting file is /var/log/account/pacct.

lastcomm 這個指令我倒是覺得還好
比較有感覺的應該是 後面加上指令名稱, 觀察哪些使用者有使用, 以及時間

# lastcomm  ls
ls                     root     pts/0      0.00 secs Sat Feb 24 13:09
ls                     root     pts/0      0.00 secs Sat Feb 24 13:08
ls                     max      pts/2      0.00 secs Sat Feb 24 12:49
ls                     ines     pts/1      0.00 secs Sat Feb 24 12:47

今天就先這樣了
~ enjoy it

Reference